Performance Dashboard —
everything on one screen
Scope360° collects your key trading metrics and presents
them in a clear, logical way.
You can see at a glance how your results are
progressing — by day, week, month — without
having to review each trade manually.

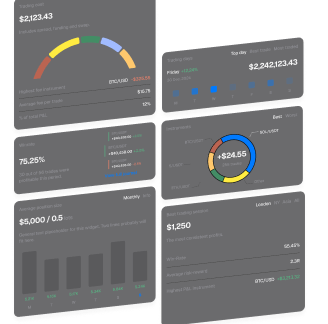
Balance and result by day
The chart shows the movement of the deposit, realized and unrealized profit, commissions.
You can see how the result has changed — without guesswork and complex calculations. This allows you to notice deviations in time and understand what they are related to.

Visualization and comparison
The data is presented in the form of graphs and tables, without excessive data.
You can compare results from different weeks or months, assess the stability of the strategy, and identify patterns. This saves time and supports decision-making.

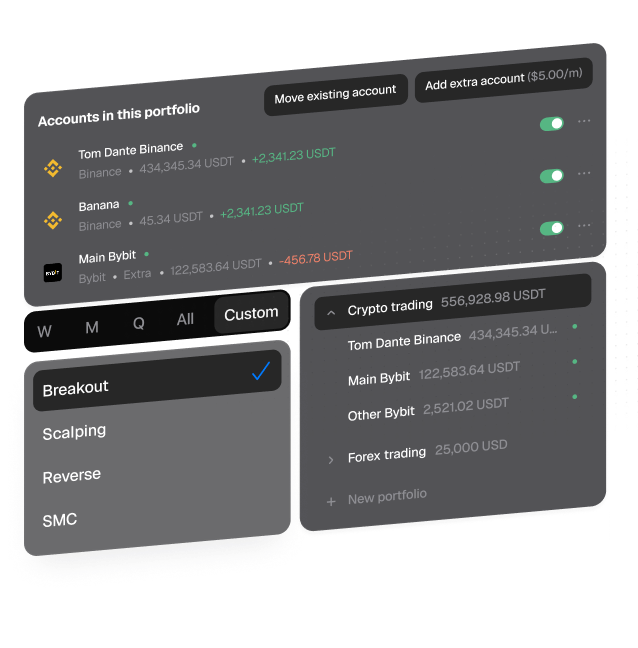
Periods, filters, details
You can choose any period: day, week, month or quarter.
Dashboard allows you to filter data by exchanges, accounts, portfolios and strategies, which is convenient if you work with several instruments or manage several accounts.

Breakdown by transactions and indicators
Everything is grouped by date: number of deals, percentage of profitable deals, average result, commissions, Winrate.
You can track the dynamics - and if necessary, return to a particular day to analyze the context.
A clear picture, no unnecessary stuff
No more manual tracking.
Scope360° shows your stats clearly and only what matters.