Trade analysis rarely ends with the final result of a position. To understand how good a trading decision actually was, you need to reconstruct the context around it: where the key levels were located, how price structure developed, which zones mattered, how much risk was built into the setup, and whether the actual move matched the original trading scenario.
Now you can do all of this directly on the trade chart in Scope360.
We have added a complete set of charting tools that allow you to perform technical analysis, mark important price levels and zones, measure price movements, calculate Risk/Reward, and preserve the visual context of each trade directly inside your trading journal.
Mark Key Levels Directly on the Trade Chart
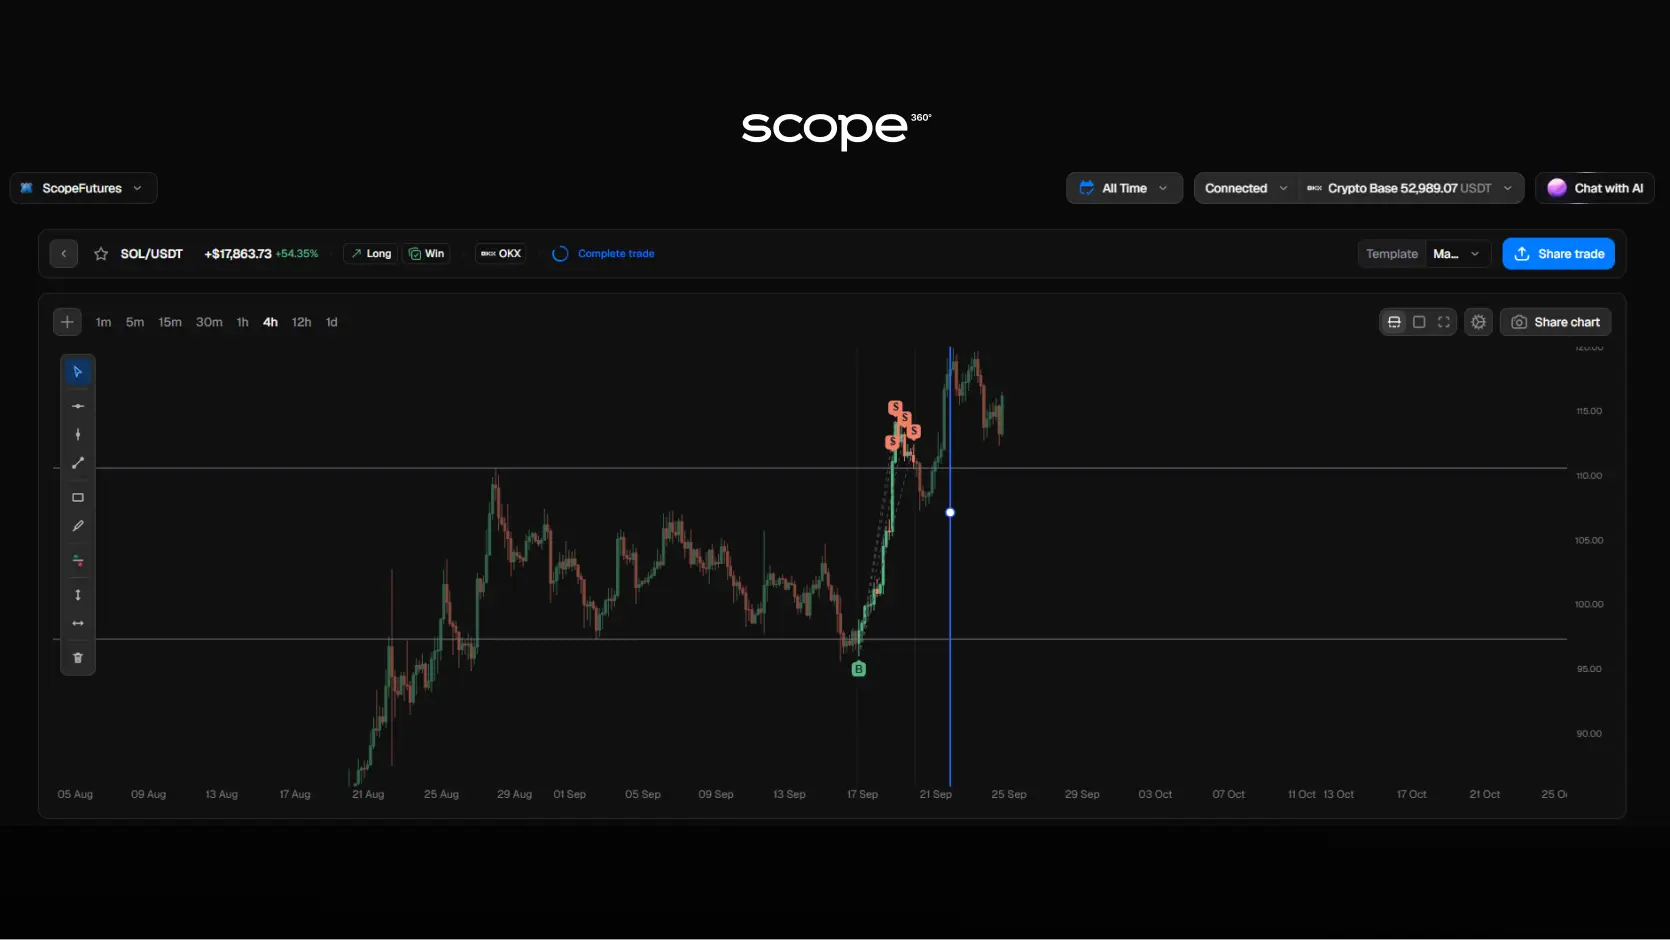
You can now add horizontal and vertical lines directly to the chart of any position.
Horizontal lines can be used to mark support and resistance levels, entry and exit prices, local highs and lows, liquidity levels, or any other price points that mattered when the trade was taken.
Vertical lines are useful for working with time-based context. You can mark the beginning of a market session, the start of an impulse, a news release, or any specific moment that played an important role in the development of the trade.
The color and thickness of every line can be customized, making it easier to visually separate different elements of your trading setup.
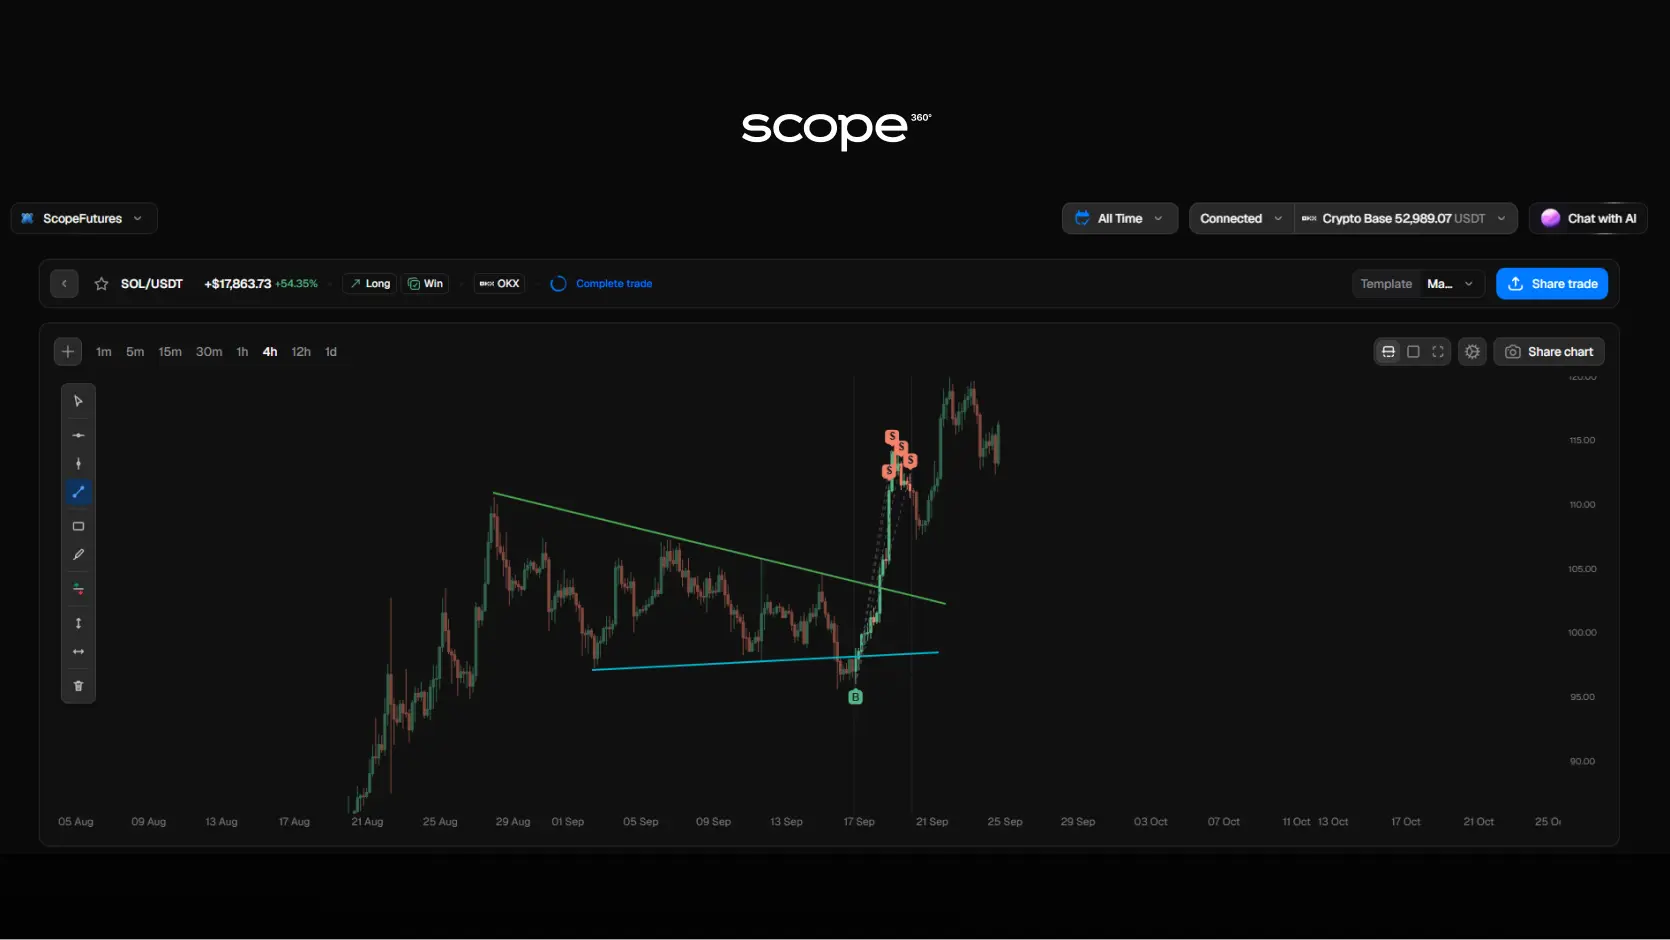
Analyze Market Structure with Trend Lines
The trend line tool allows you to connect any two points on the chart and freely control its direction, length, and position.
You can use it to mark local trends, impulsive moves, market structure, breakouts, and other elements of technical analysis directly on the historical chart of your trade.
The color and thickness of the trend line can also be adjusted to match your own charting system.
Highlight Important Price Zones
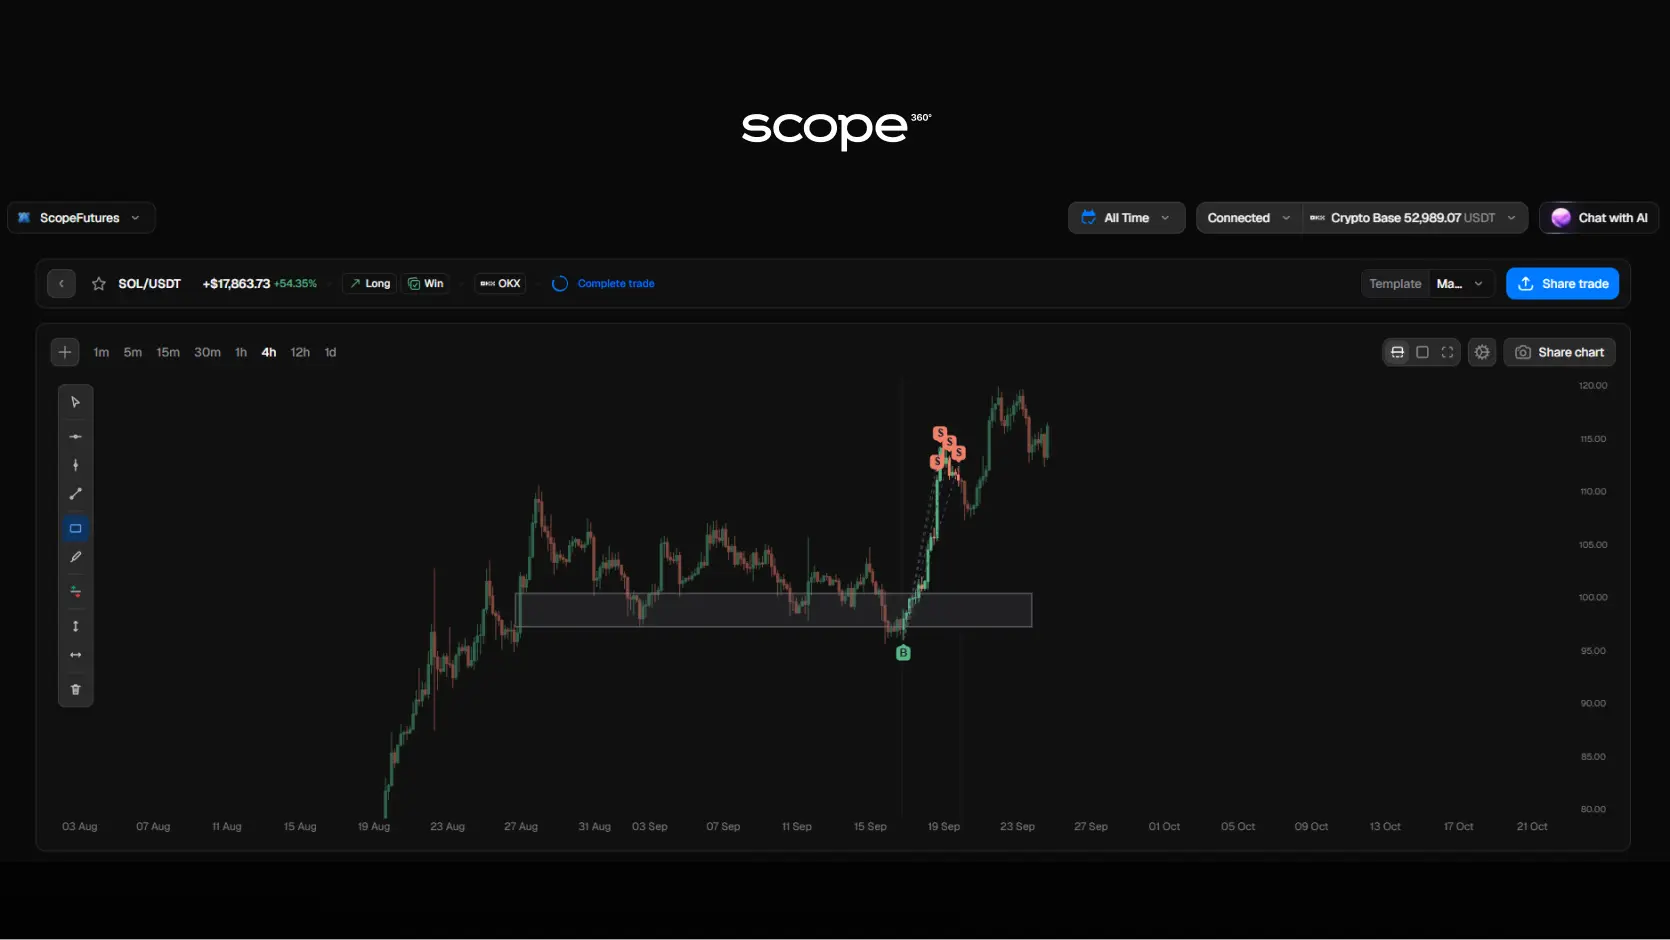
Not every important area on the chart can be reduced to a single price level. That is why we have added a rectangle tool for highlighting specific zones.
It can be used to mark support and resistance areas, consolidation ranges, liquidity zones, imbalances, potential entry areas, or any other price range that plays a role in your trading strategy.
The border thickness and background color can be customized separately, allowing you to keep multiple zones on the chart without making the analysis difficult to read.
Draw Your Own Notes and Markups
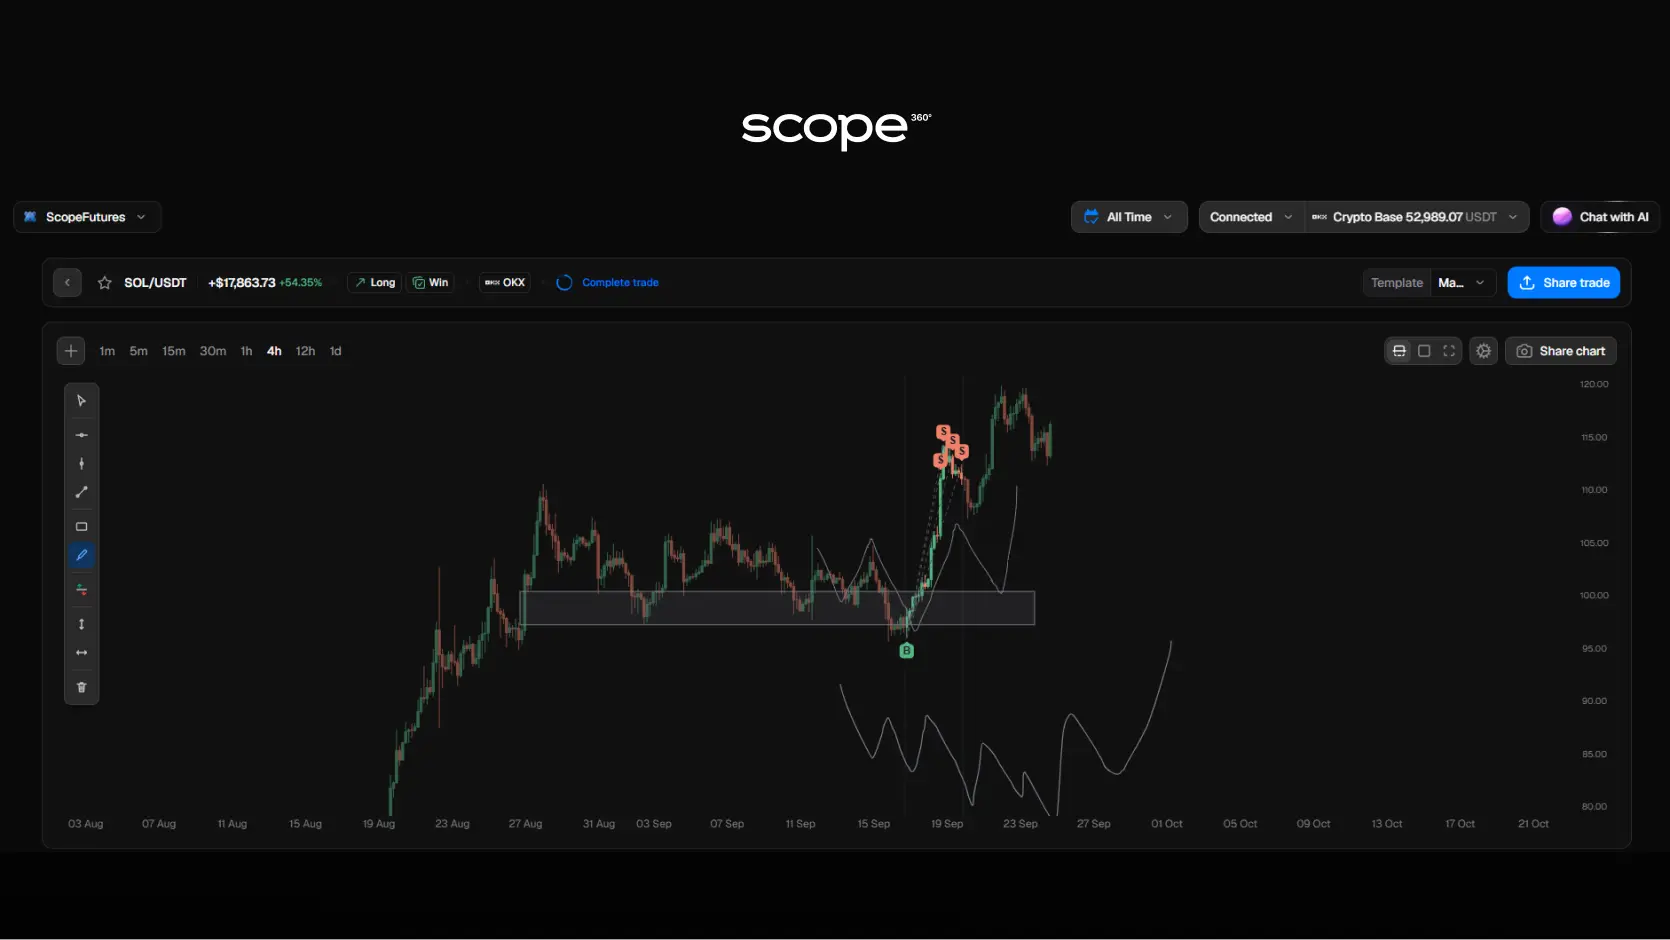
For situations where standard charting tools are not enough, Scope360 now includes a freehand drawing tool.
You can draw directly on the chart, highlight specific price movements, illustrate an expected scenario, mark patterns, or visually emphasize details that you want to review later.
Both the color and thickness of the drawing line can be changed directly in the tool.
Calculate Risk/Reward on the Actual Trade
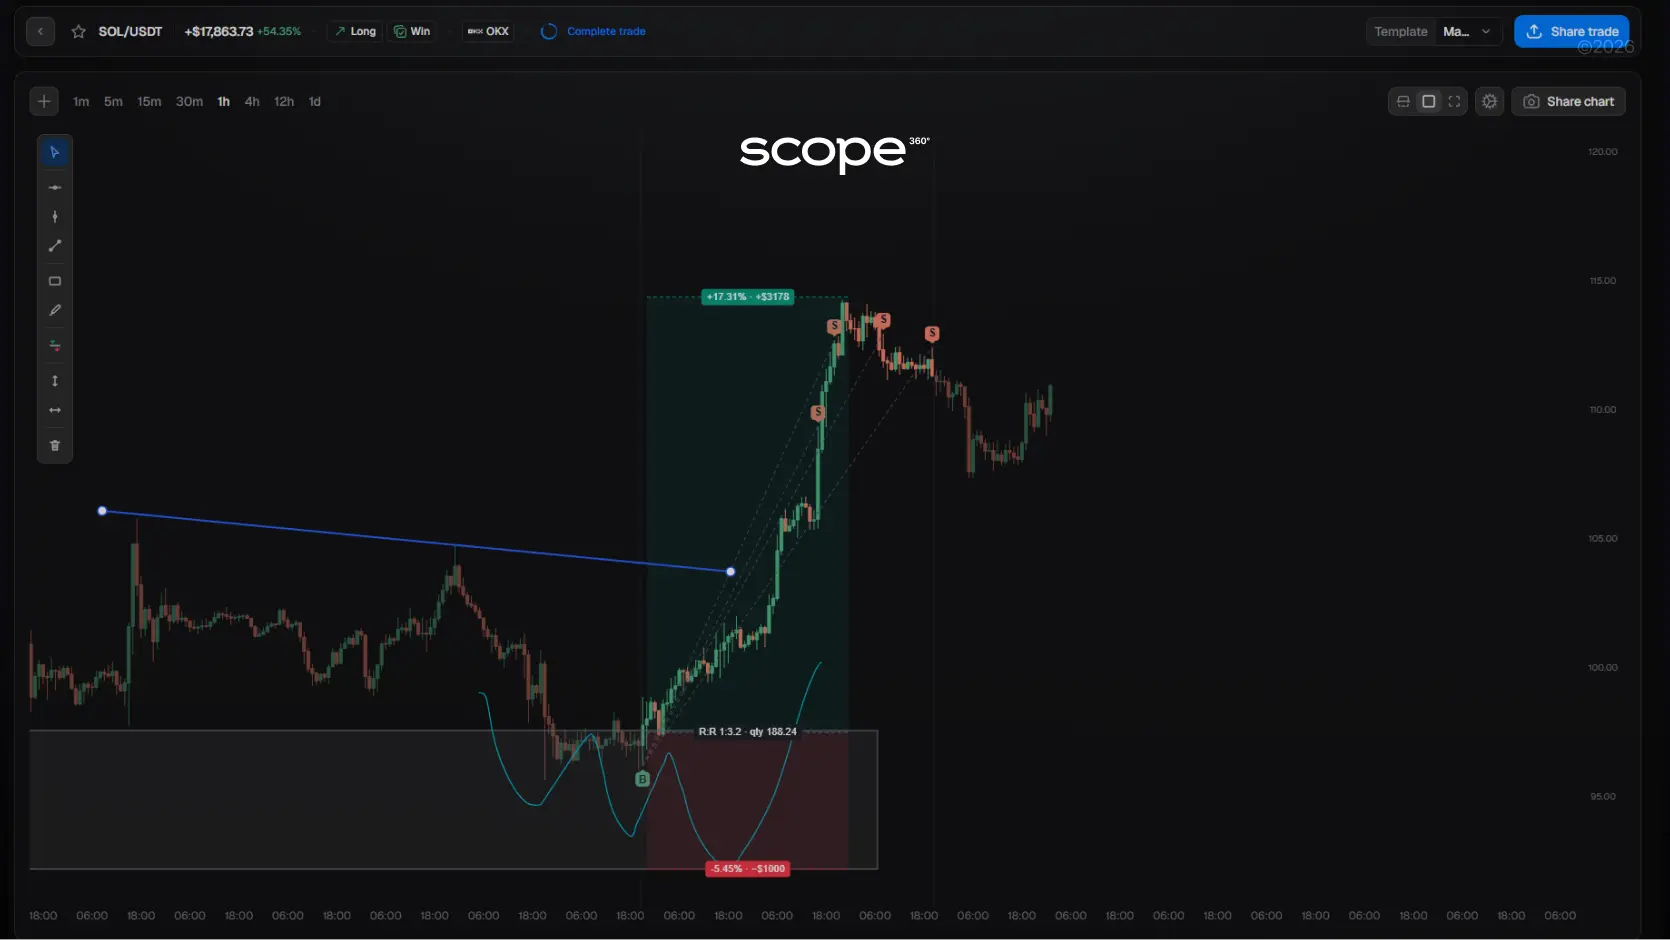
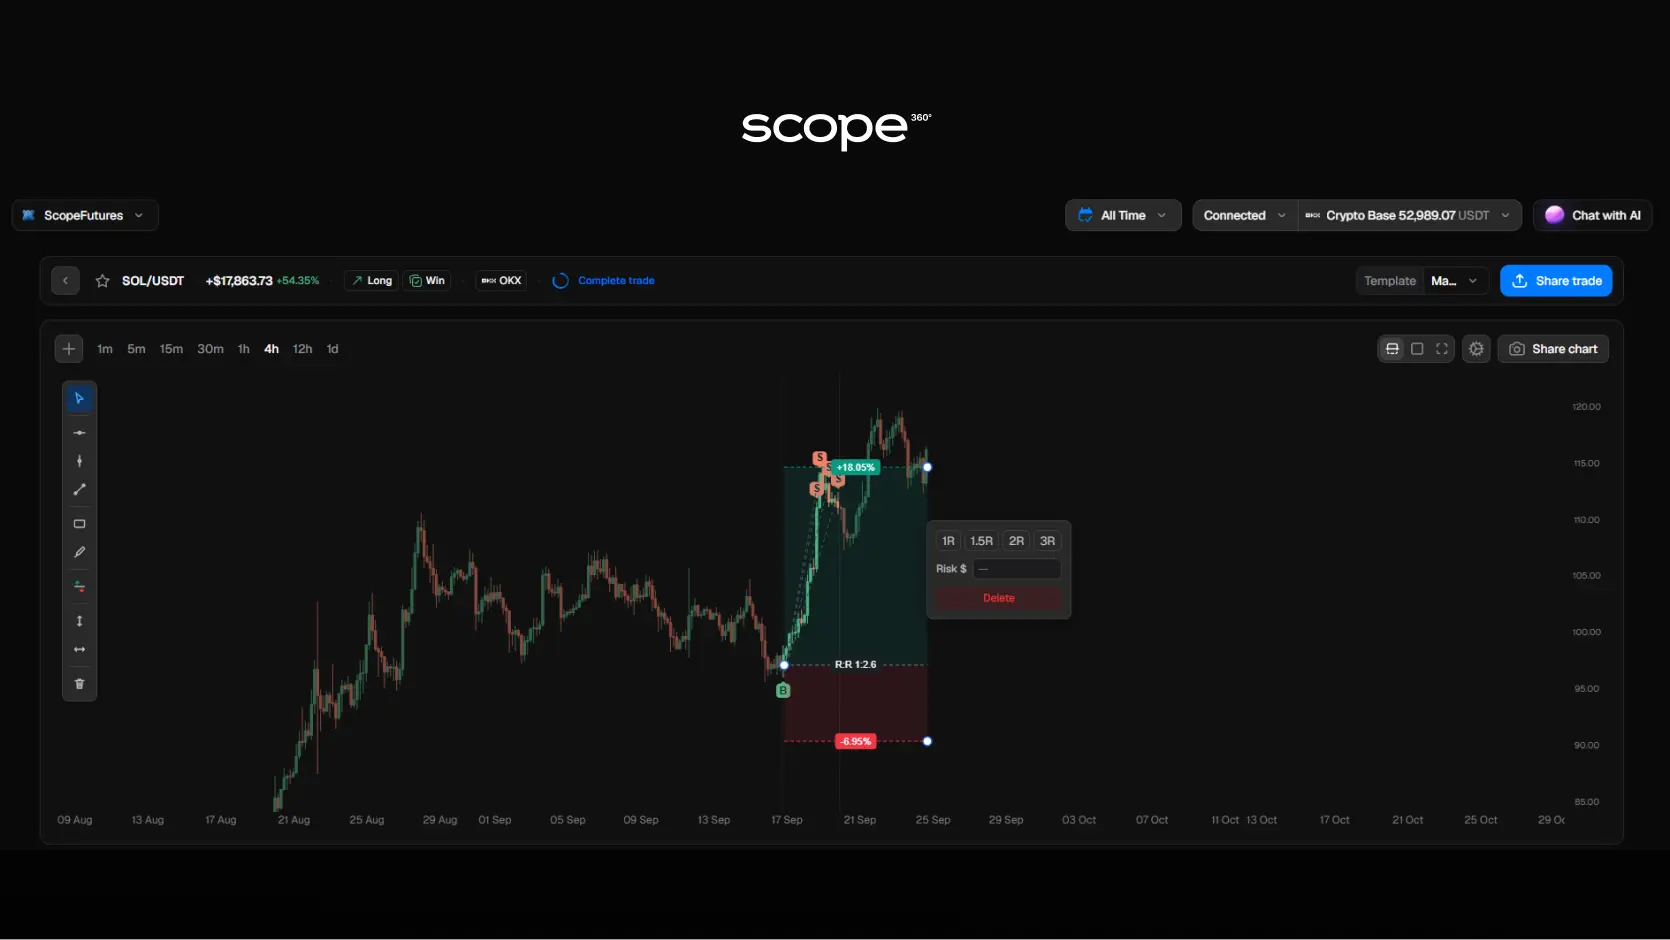
One of the most useful additions is the Long/Short Position tool, which allows you to visually build a trade setup directly on the chart and evaluate its parameters.
Set the entry point, potential Stop Loss, and Take Profit, and the tool will automatically display the Risk/Reward ratio together with the potential percentage loss and profit.
This becomes especially useful when reviewing completed trades. You can reconstruct the original setup, check the Risk/Reward that was available at the time of entry, and compare it with how the market actually moved afterward.
The trade chart therefore becomes part of your risk management analysis, allowing you to evaluate not only the final PnL, but also the quality of the risk structure behind the result.
Measure Price Movements in Dollars and Percentages
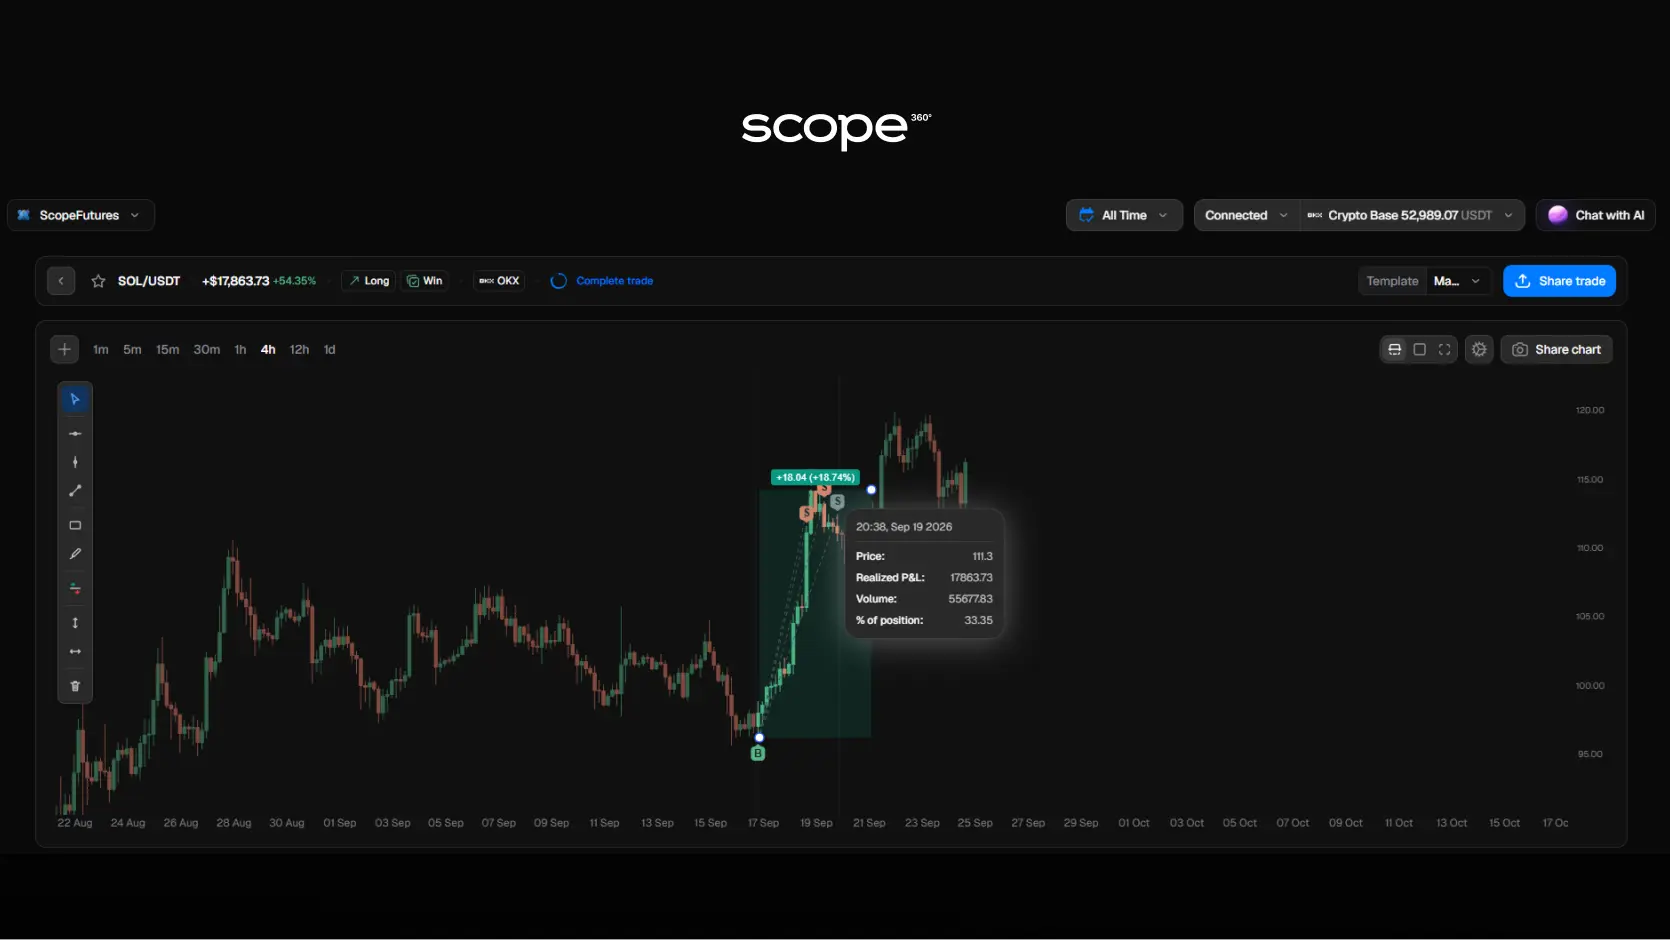
A new price measurement tool allows you to calculate the exact movement between any two points on the chart.
Select the starting and ending points, and Scope360 will show the change in both dollar value and percentage terms.
You can use this tool to measure impulses, pullbacks, potential moves toward a target, or the actual price movement that occurred after entering a position.
Instead of estimating the distance visually, you get precise values directly inside your trading journal.
Measure Time and the Number of Bars
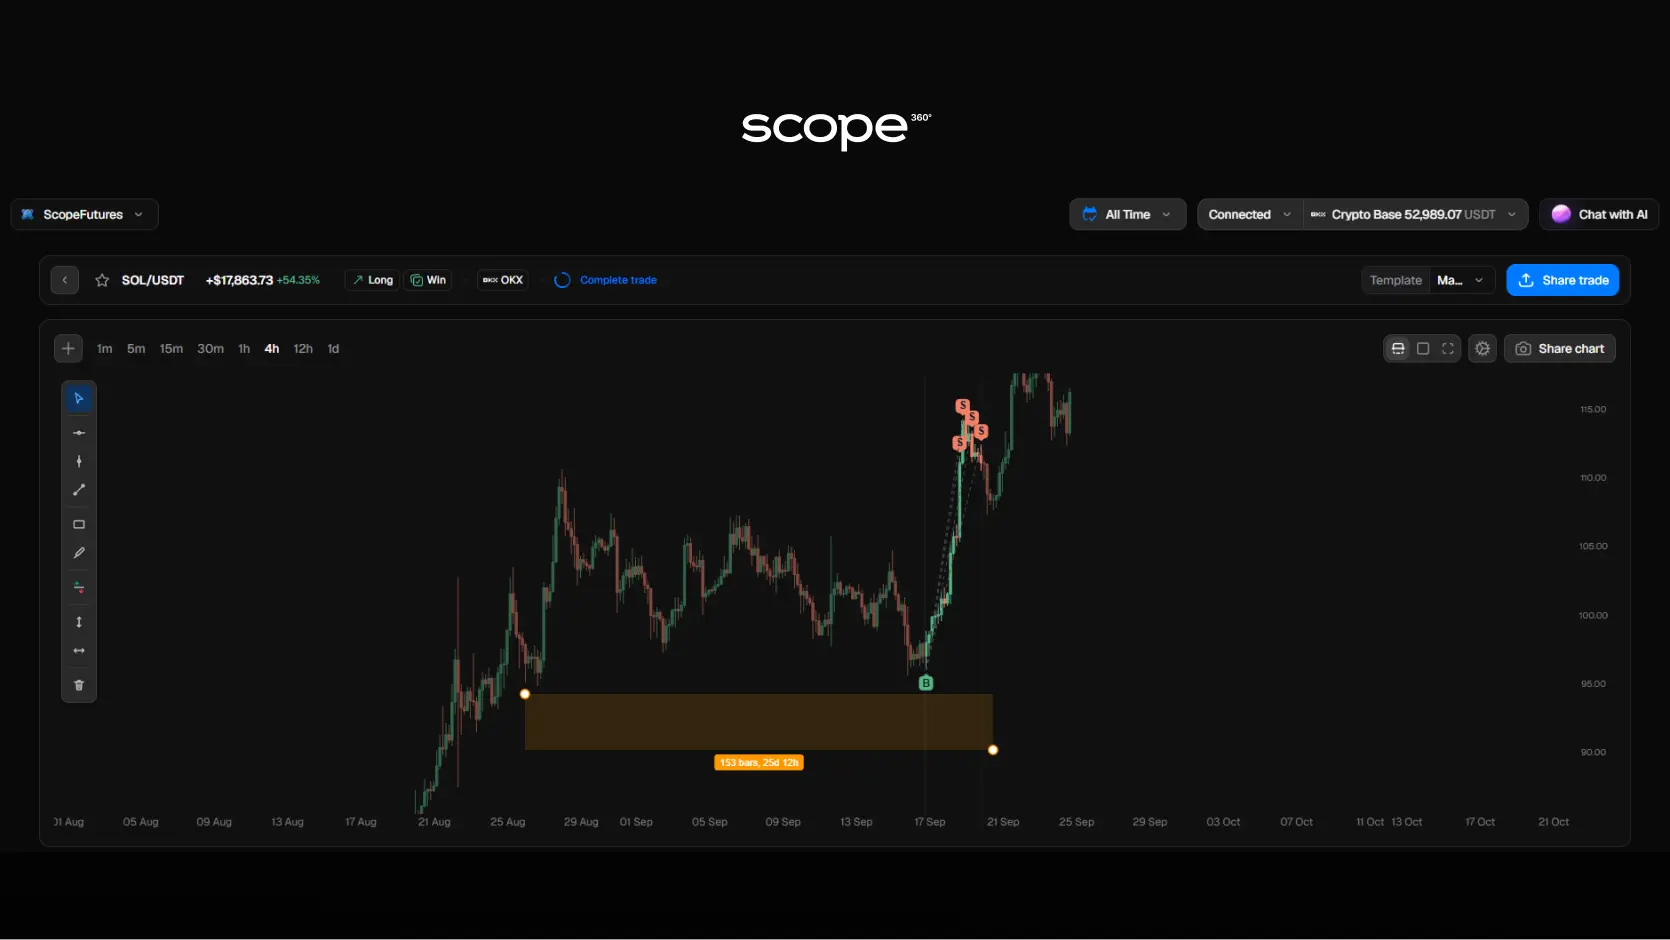
Scope360 now also includes a dedicated time measurement tool that shows the distance between two selected points in both bars and actual elapsed time.
It can be used to analyze the duration of impulses and corrections, compare different phases of market movement, and evaluate how long it took price to reach a specific level.
This adds another layer to your trade analysis, because you can now evaluate not only how far the market moved, but also how quickly the trading scenario developed.
Turn Your Trade History into Working Material
A trading journal should do more than store statistics. The more context you preserve around every position, the easier it becomes to understand your own decision-making process and identify recurring patterns in your trading.
With the new charting tools in Scope360, you can open any trade, reconstruct its structure directly on the chart, mark important levels and zones, draw trend lines, measure price and time, calculate Risk/Reward, and add your own visual notes.
Combined with the analytics and statistics available in the trading journal, this creates a much more complete picture of every position and gives you more useful material for reviewing and improving your trading process.
Open your trades in Scope360 and analyze them directly on the chart.